David & Goliath.

Moving from freelancer to guru.

Client

Show Me Your Data ⋅ Web Analytics

Studio Expertise

Brand Design
Brand Strategy
Positioning
Storytelling: vision, mission, values
Definition & structure of service offering

Project partners

Graphic Design - Benoit Clair

In a nutshell

Our client, a leading in expert web analytics, had been working for the premier consulting groups in the industry for over 10 years. He had a stellar reputation with clients. But when the time came to go out on his own and launch a new web analytics agency, Show Me Your Data, this reputation was not enough to land the same caliber of projects he had grown accustomed to. Overcoming negative misperceptions linked with his freelancer status was a struggle.
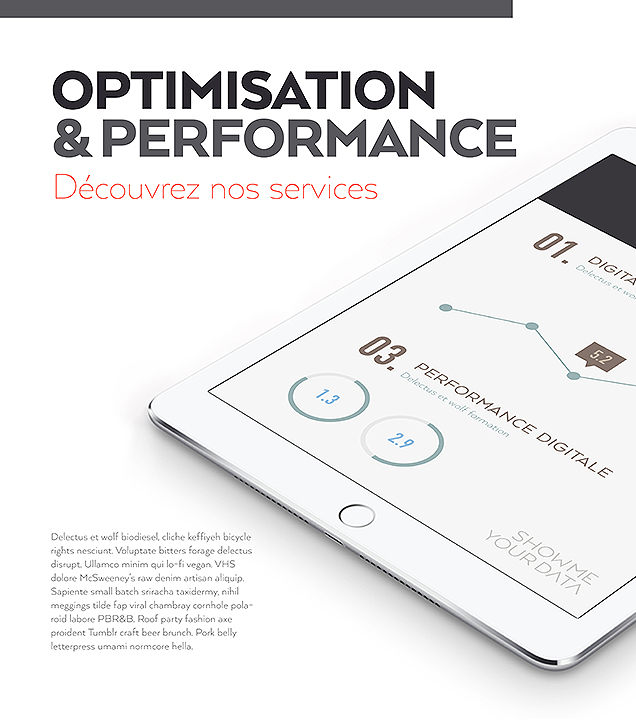
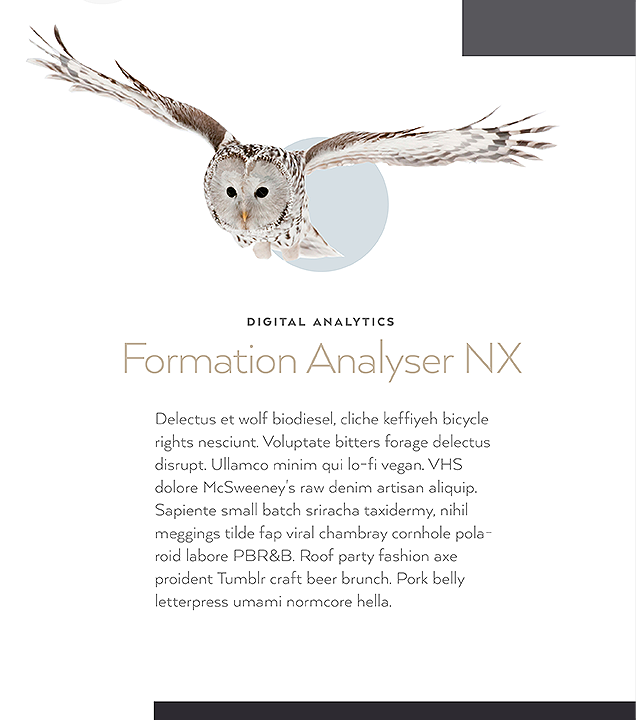
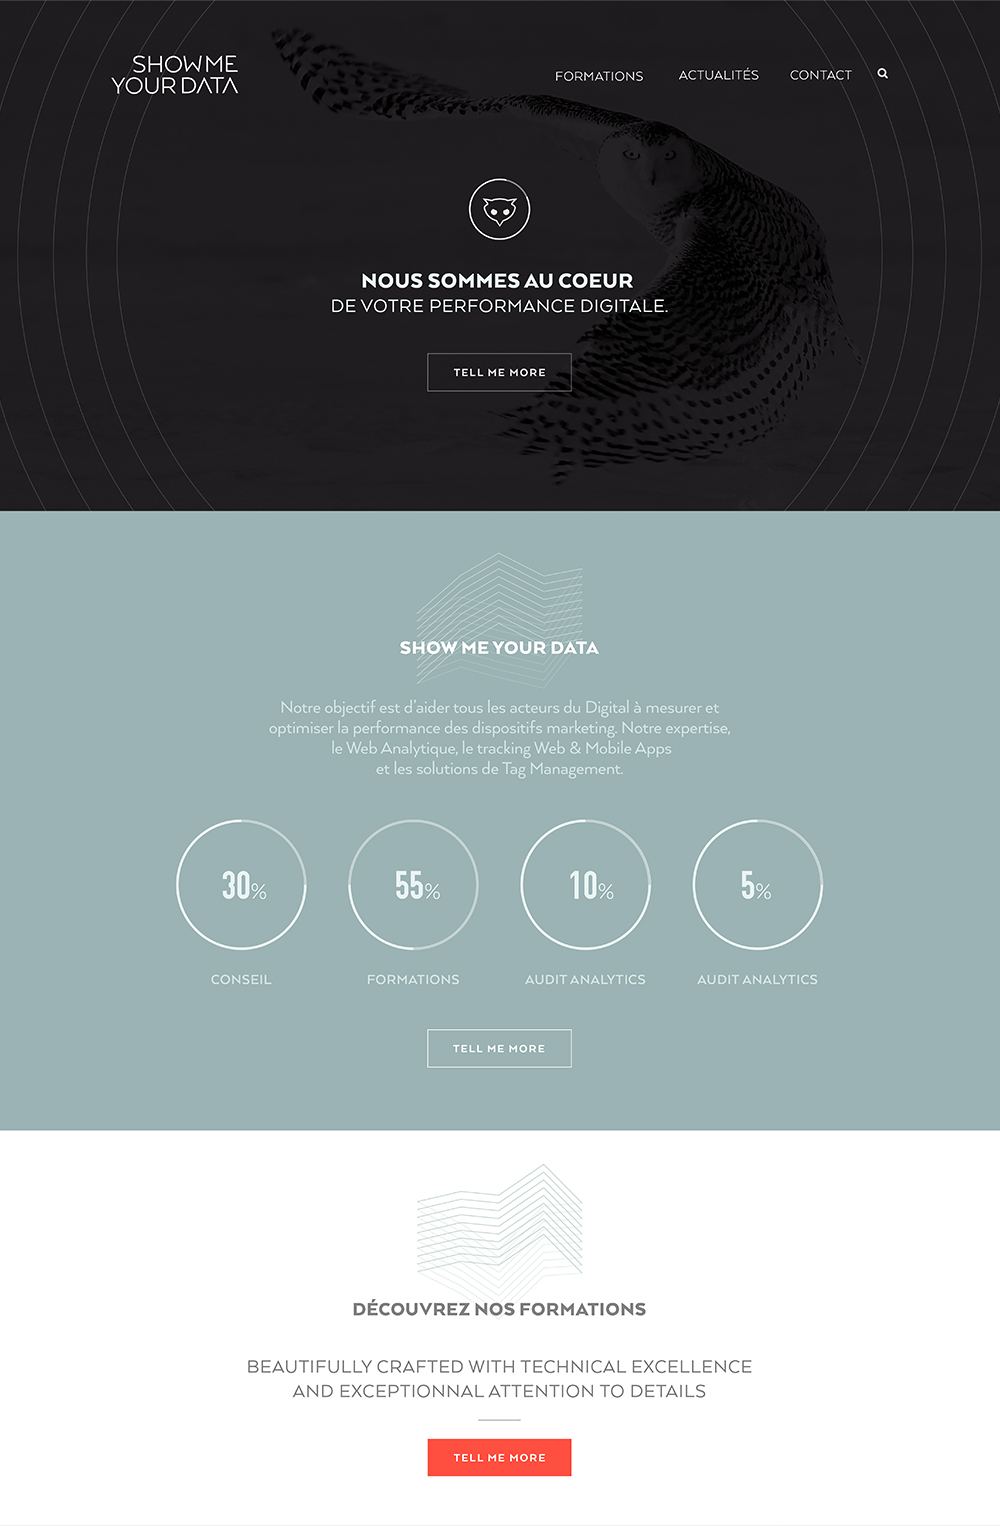
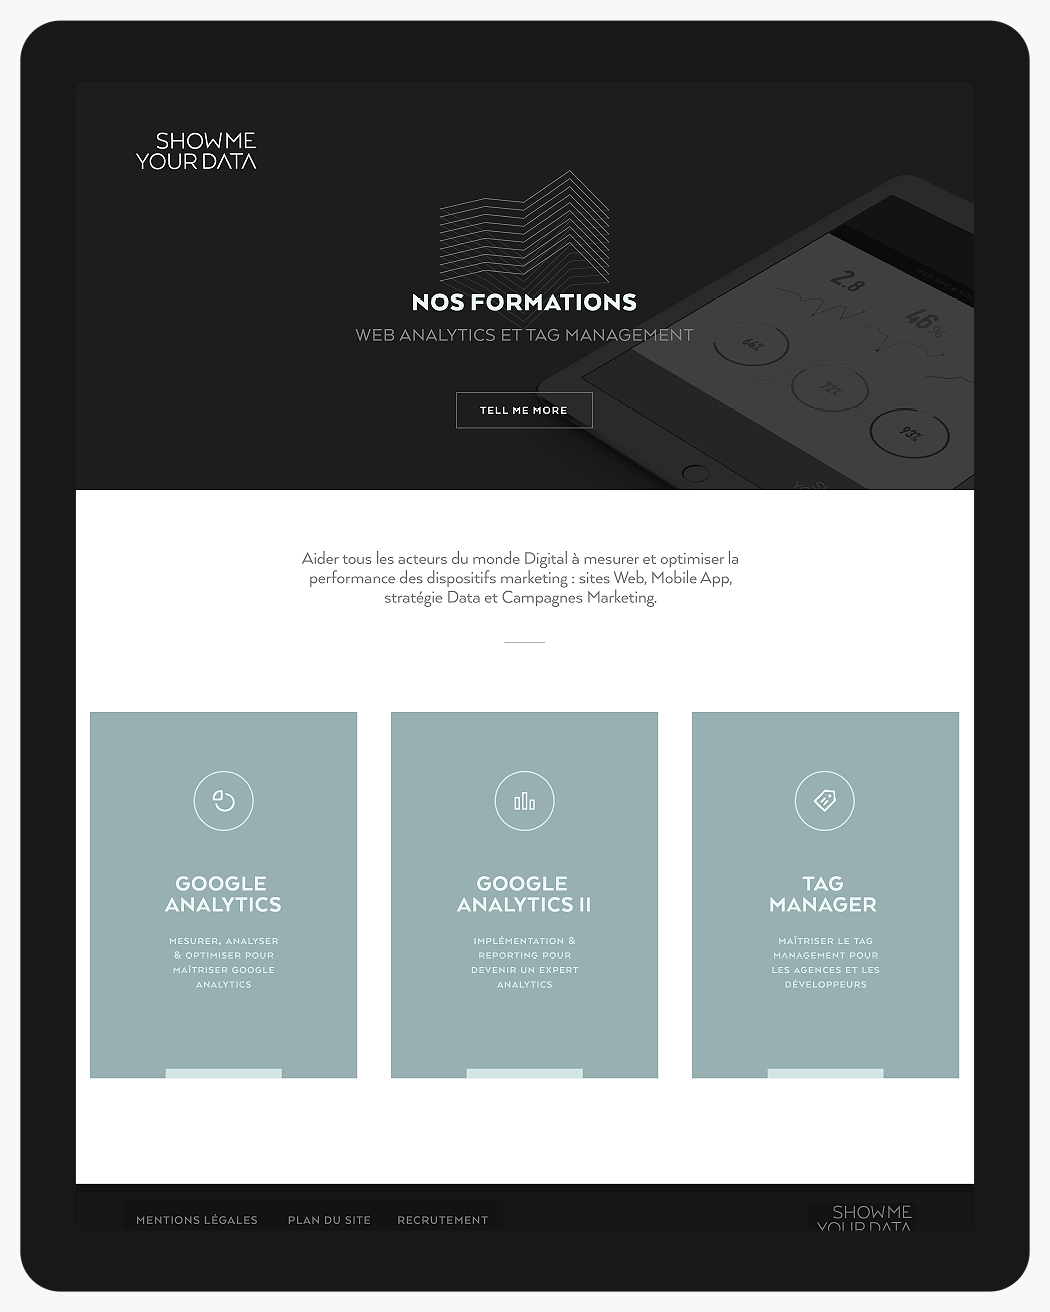
We developed a brand identity for Show Me Your Data that was designed to impart their unique point of view and philosophy, positioning them not as a young freelancer, but as an experienced guru. By translating their talent, vision and experience into a brand, we helped them to clearly communicate their value as well as highlight their stability and trustworthiness.

At the time of writing this client has not had to engage in any additional marketing activities since the brand and website launch, and that was 10 years ago. 25% of business has been in calls with 75% referrals. The result is that this freelancer is doing what they love at the level they want to do it at.

5 minute read

Insight

The image of a freelancer is tricky. It can work for or against us. While it does have some positive connotations, it also brings with it the perception of being unreliable or unstable, and perhaps incapable of taking ownership of large or long-term projects. This creates fear. What’s more, freelancers are generally expected to be cheap. Show Me Your Data was not cheap; they were one of the most expensive consultancies on the market. In addition, their objective was to work on cutting-edge web analytics projects with fortune 500 companies as well as smaller enterprises. So they needed to emphasize their permanency, reliability and long-term commitment to their work.

In addition, Show Me Your Data had extensive experience with all of the existing software solutions on the market giving them a bird’s eye view that their competitors lacked. As a result, their approach was led by business needs rather than constrained by the technical functionalities of one software solution.

The need was to shift the perception of the value of web analytics from the software to the people. So a web analyst doesn’t just measure data points and fix code, they help you understand your business better. Data tells us stories that can deliver unique insights into how companies can better serve their clients. In other words, the software solution you use to extract the data is secondary, it’s what you do with the data that matters. That’s where the wisdom is. That’s where the value is. Show me your data and we’ll tell you who you are.

What we did

We developed a brand identity that was designed to convey Show Me Your Data’s business-led approach, bird’s eye perspective and broad experience.

— The truth was that they were a guru in their industry and already an authority in their field. The right brand would help make that truth clear, visible and tangible.

An owl surrounded by a circle?
Wisdom, informed by data.

1.

Logo

A symbol of precision and knowledge, the owl has a dual capacity to see all things and still pick out even the smallest detail with precision. This echoes the business of Show Me Your Data: keen observation and analysis based on precise data and details. Being a symbol of night time activities, the owl mirrors the behind the scenes, back-office nature of Show Me Your Data’s activities.

The powerful combination of the icon + word mark delivers a clear message that wisdom comes from our analysis of what we see while conveying the human, business-focused approach of Show Me Your Data.

The word mark and icon can be used either together or separately. This allows for flexibility and adaptability in line with communication needs.

The circle recalls the value of the visual illustration of data as well as a bird's eye perspective and global vision. The owl, staring out boldly from the very centre of the circle, evokes the image of the calm eye of the storm.

The icon is perfectly adapted to all media formats, including digital platforms.

The word mark uses strong geometric shapes and capital letters to convey confidence and boldness as well as evoke stability and durability over time.

The two A symbols of the word DATA retain a sense of cryptic mystery, evoking the unknown as well as recalling the digital environment and language of code.

2.

Colours

Dark colours evoke the premium quality of the service and convey a sense of excellence. Their combination with lighter, muted tones evokes confidentiality, precision and discreteness, important values in the world of data analytics.

The chosen colours inspire serenity and balance. We are invited into a universe of slow thinking and analysis that delivers valuable and confident insights based on evidence, in contrast to the hectic, ever-changing environment of data production and collection.

Chosen colours stand out from the usual brand universe of web start-ups that tend to be brighter, multi-coloured and extrovert.

3.

Data made visual

A series of graphic illustrations were created to enable Show Me Your Data to convey how they see Data: intriguing, beautiful, powerful and dynamic. These illustrations give visual form to the concept of wise data and allow the company to graphically represent its philosophy. By visualising the concept of data in this way, we are also mirroring the business: making something that is usually unseen or hidden appear before us.

4.

Typeface

The typeface is geometric and architectural so as to work in perfect harmony with visual representations of data that will be associated with it such as diagrams, charts, histograms.

There is a large contrast between capital and lowercase letters which mirrors the two key aspects of the business:

  • Raw Data & Details → Lowercase
  • Analysis & Overview → Capitals.

5.

Website

The website is the culmination of all the brand elements outlined above working in perfect harmony to produce an integral brand experience that conveys the essence of Show Me Your Data’s value and vision.

Results

Not a freelancer.
A guru.

Today the company is 10 years' old, and at the time of writing it has not had to engage in any external marketing activities whatsoever since the brand and website launch.

25% of business has been incoming calls with 75% referrals. The brand helped to convey trustworthiness and create confidence. When meeting new clients for the first time, Show Me Your Data found that the communication had already done 90% of the selling. This meant they could focus these meetings on solving clients’ problems rather than wasting time convincing clients they were the right agency for the project.

Potential clients who checked the website wanted to work with the company before meeting them. When clients called Show Me Your Data, they were no longer asking questions about the company or requesting presentations on what they did, they were asking for quotations.

Show me your data is currently turning away business.

— The brand did 90 % of the selling.

To date, the company has never had to do a formal presentation of itself to a potential client. This has been an enormous time saver and has allowed the company to enter at the level where they belong. They are not considered freelancers; they are considered one of the leading web analytics agencies in France.

Let’s talk! — We’ll look after you.